

Species Richness and Rarity-Weighted Richness Data
Species Richness and Rarity-Weighted Richness rasters
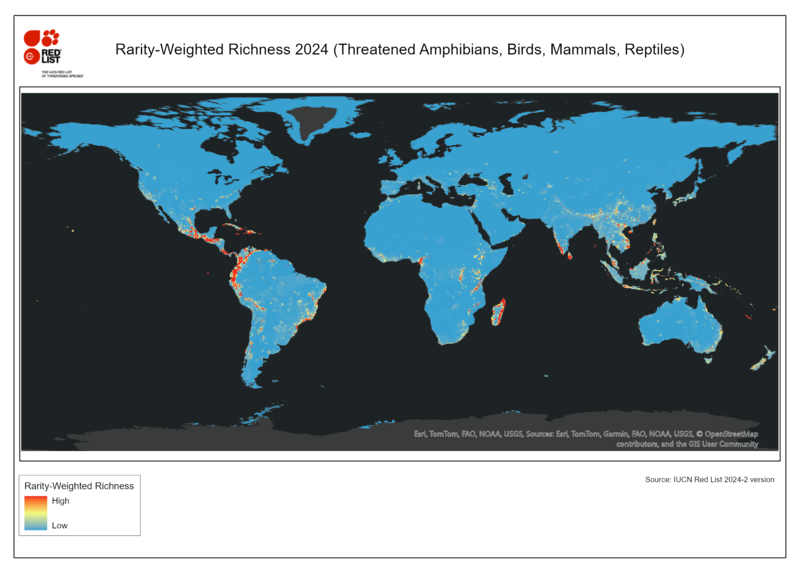
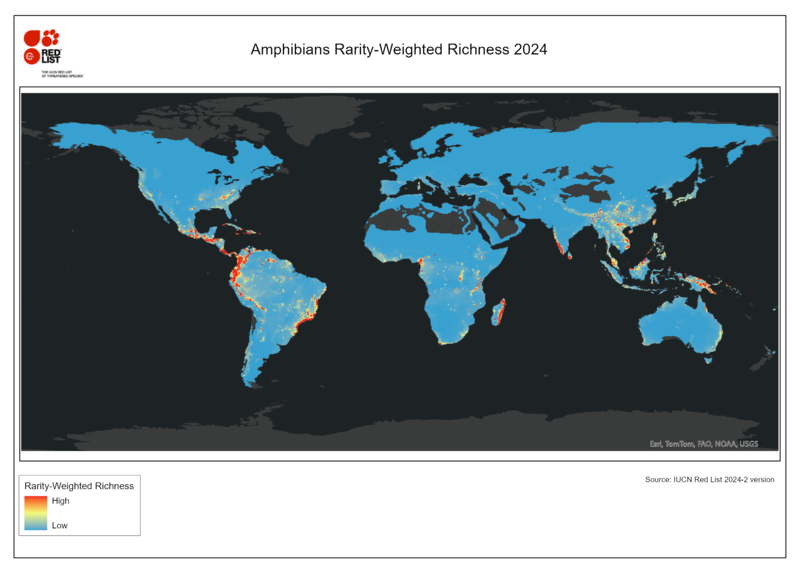
The rasters available on this page are based on the raw IUCN ranges for amphibians, birds, mammals and, from 2022, reptiles.
The data is biased towards vertebrates as these are currently the terrestrial taxonomic groups that have been comprehensively assessed and for which there are polygon maps. The analyses are only relevant for terrestrial areas, as marine areas will only be represented by birds and mammals.
The analyses available to download from this page are:
Red List version 2024-2
Red List version 2023-1
Red List version 2022-2
Red List version 2021-3
Red List version 2017-3
About the Species Richness and Rarity-Weighted Richness analyses
Both analyses are measures of biodiversity calculated for each cell of an equal area grid. This required the ranges to be filtered, for example to exclude ranges where the species is deemed extinct.
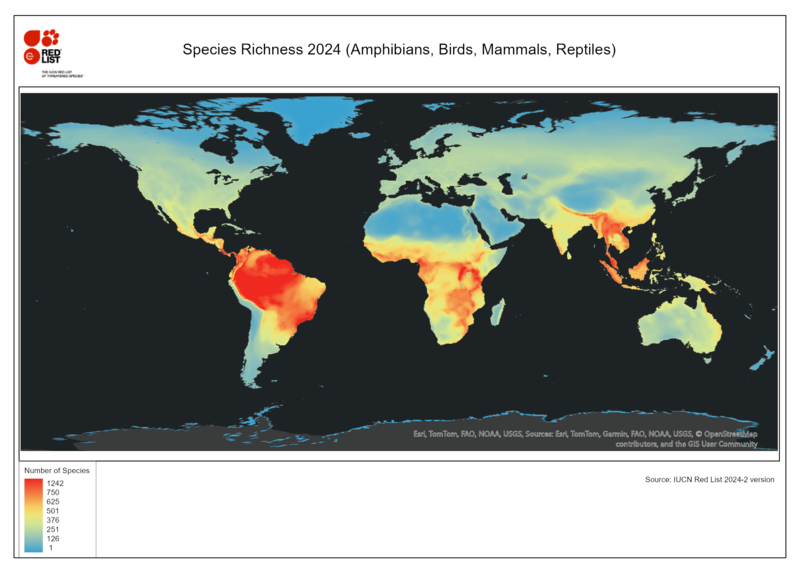
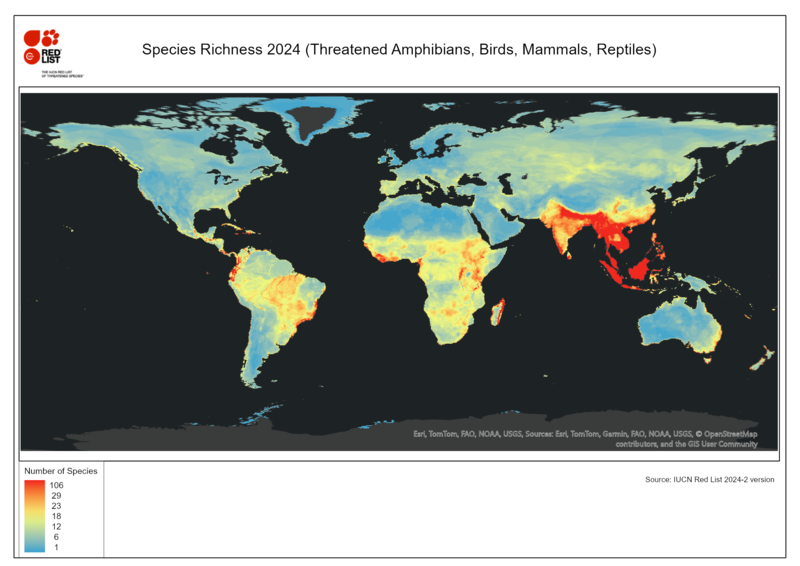
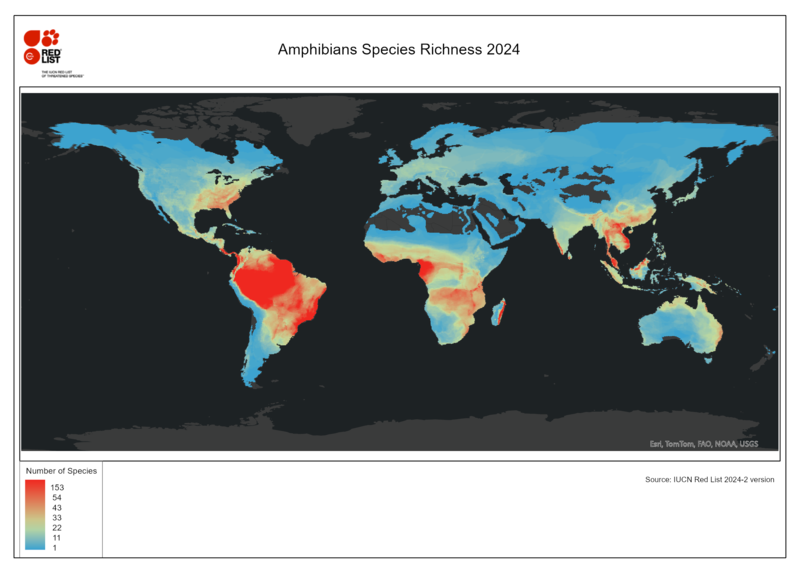
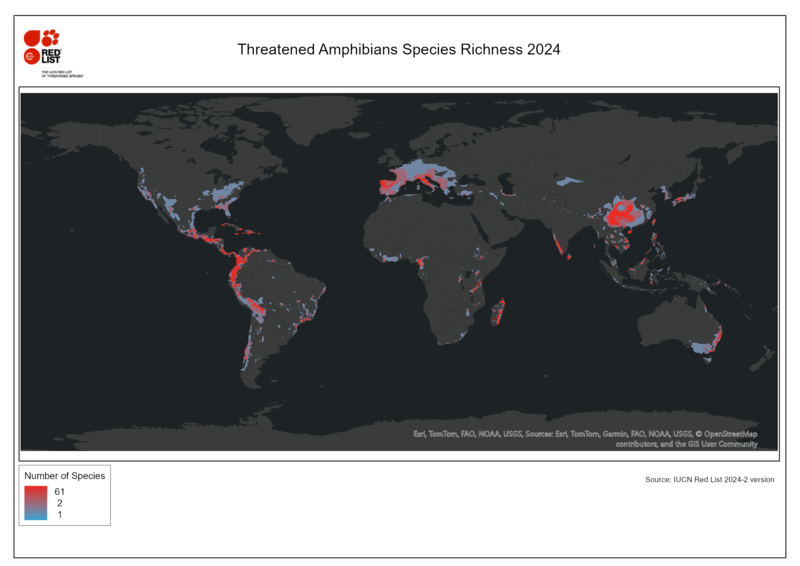
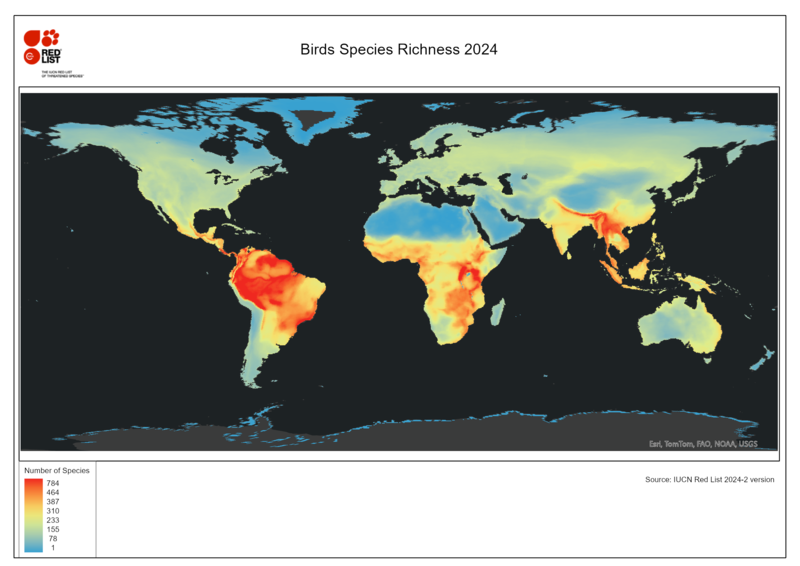
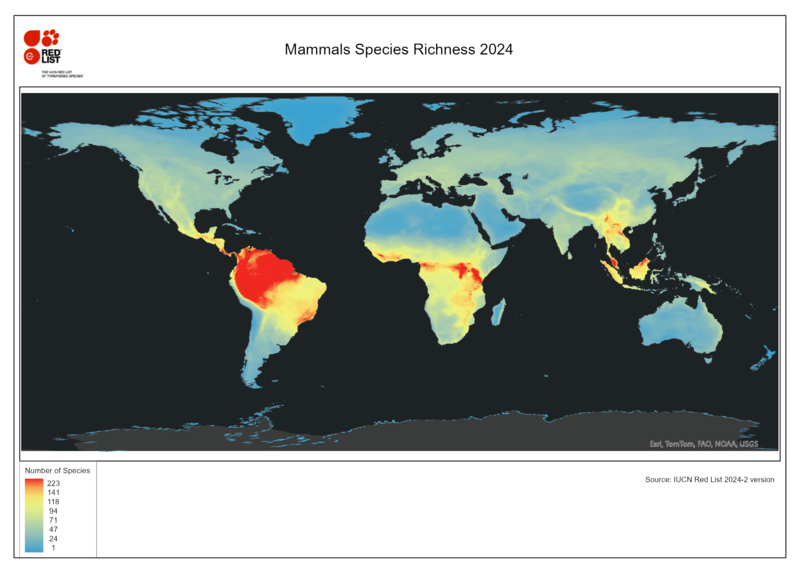
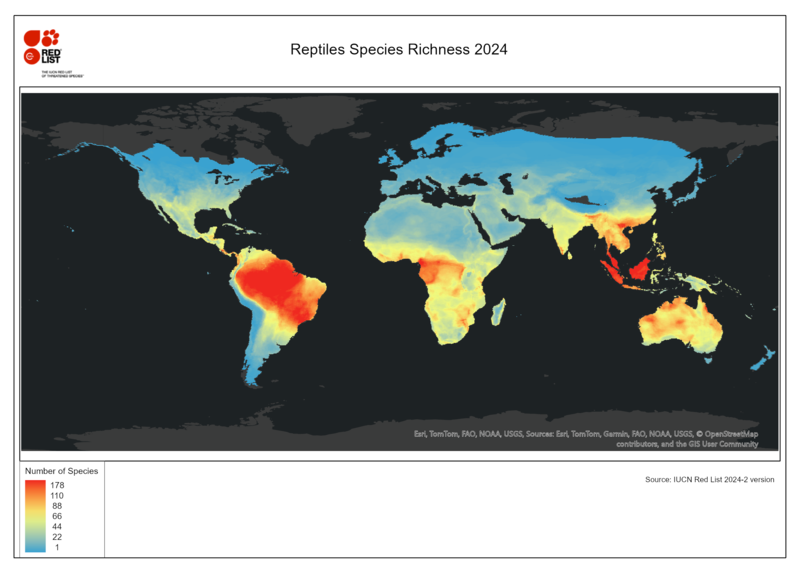
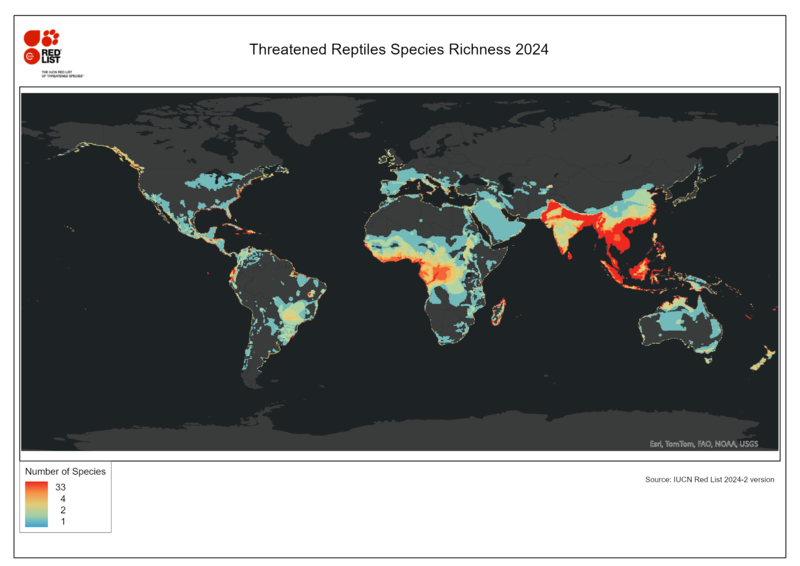
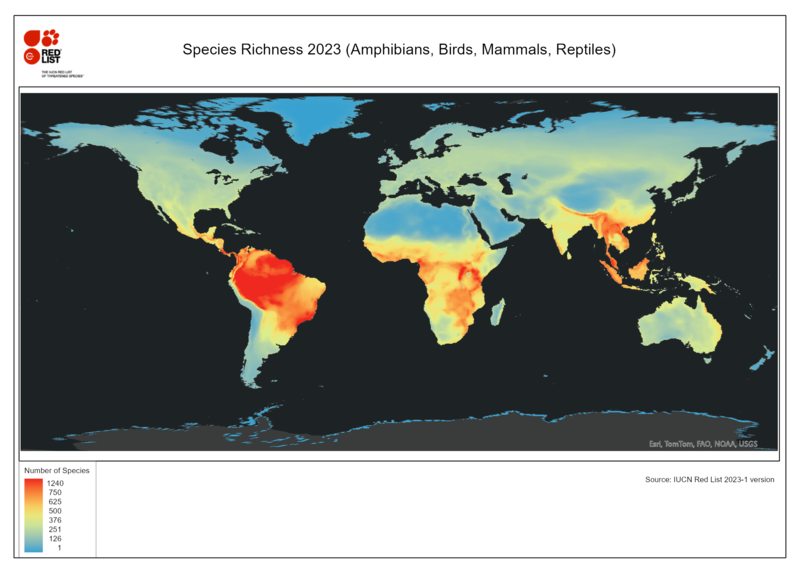
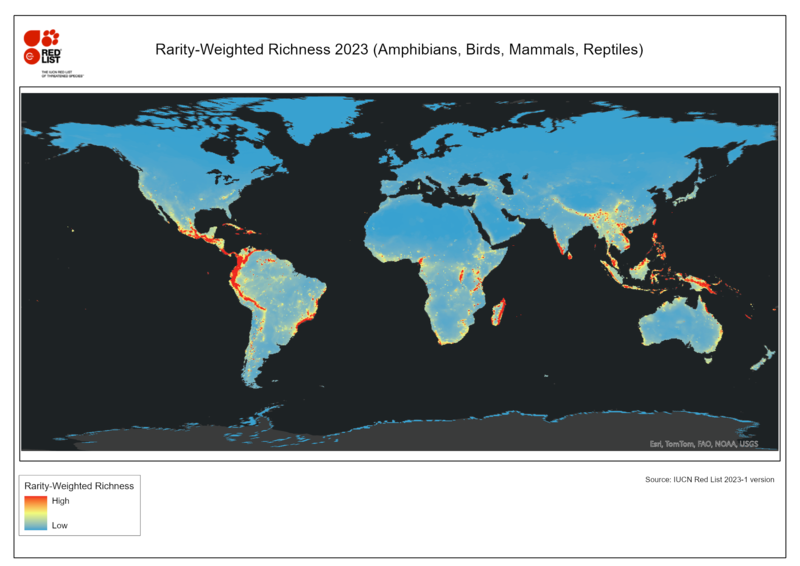
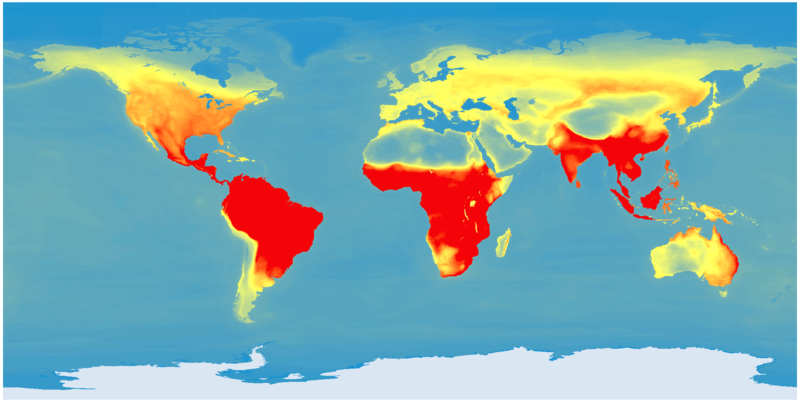
Species Richness is a count of the number of species potentially occurring in each grid cell.
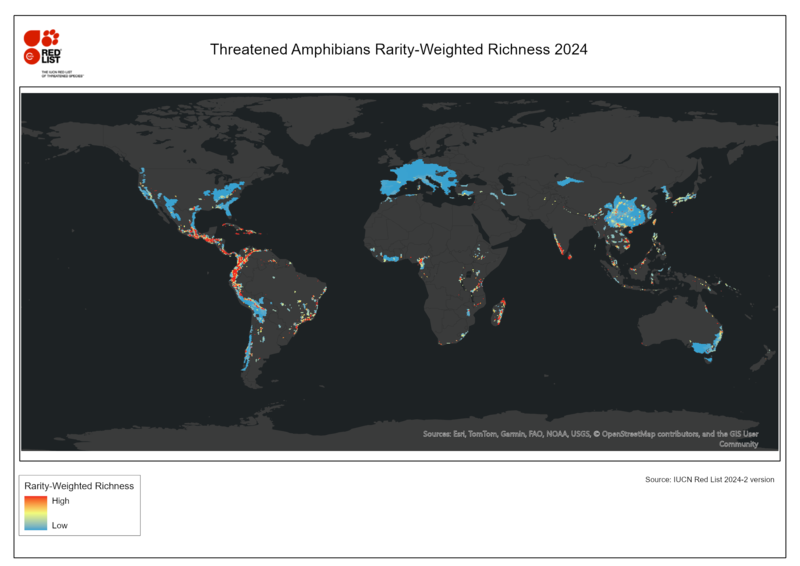
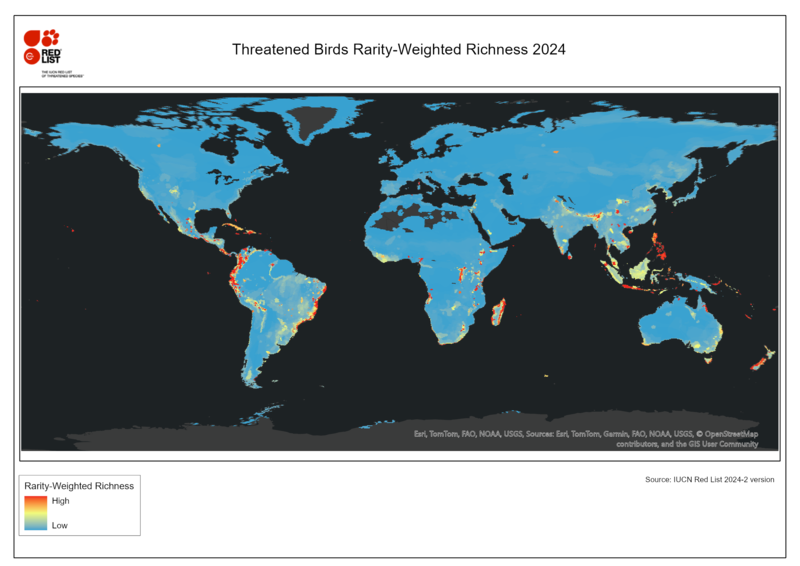
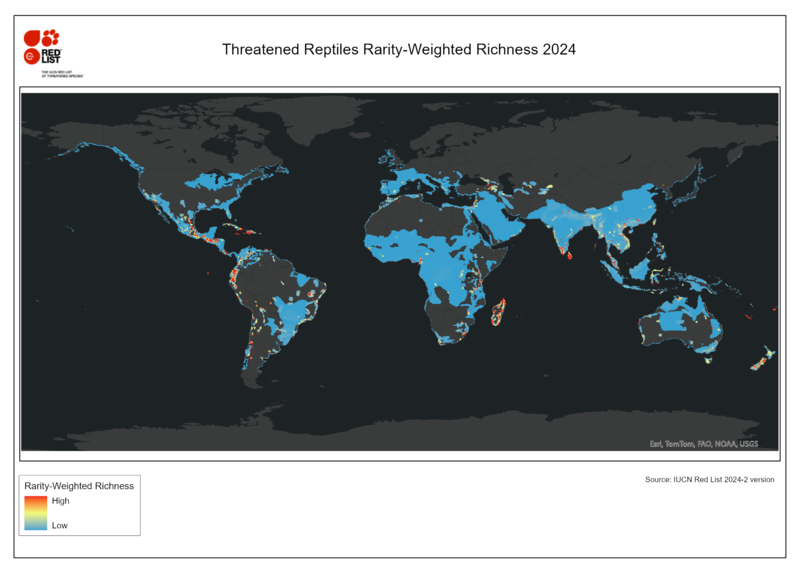
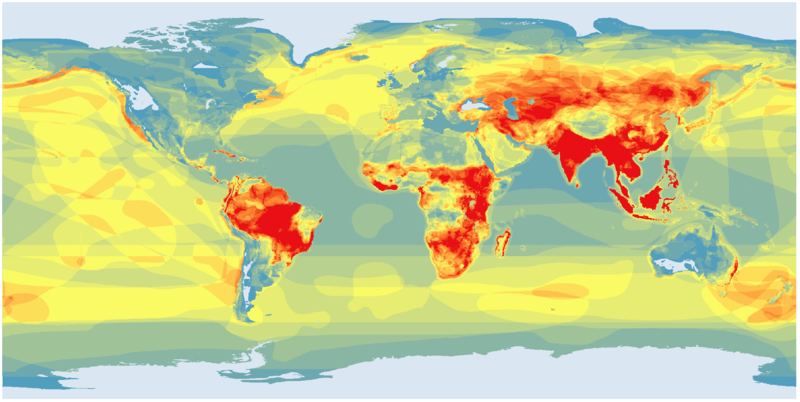
Rarity-Weighted Richness is the aggregate importance of each grid cell to the species occuring there. The value does not have any units, but indicates relative importance.
For each species the Rarity-Weighted Richness value for a cell is the proportion of the species' range contained within that cell. This can be the area of the pixel divided by the area of the species' range or (as in these analyses) 1 divided by the total number of cells overlapped by that species' range. These values are summed across all the species in the particular analysis to give the relative importance of each cell to the species found there.
For species with different breeding and non-breeding ranges, where a cell is contained in both ranges, the calculation is based on the smaller range, i.e. the season in which that area is more important.
Input data
These analyses have been performed for two types of input data:
The raw IUCN ranges for amphibians, birds, mammals and, from 2022, reptiles were intersected with a grid of 865 km2 hexagon cells, clipped to the coastline. Marine-only species were excluded from the analyses. As the species ranges have not been refined (for example, by altitude and landcover), there may be a fair amount of unsuitable habitat in the raw ranges, resulting in errors of commission.
Each Species Richness and Rarity-Weighted Richness analysis based on range polygons has been performed for:
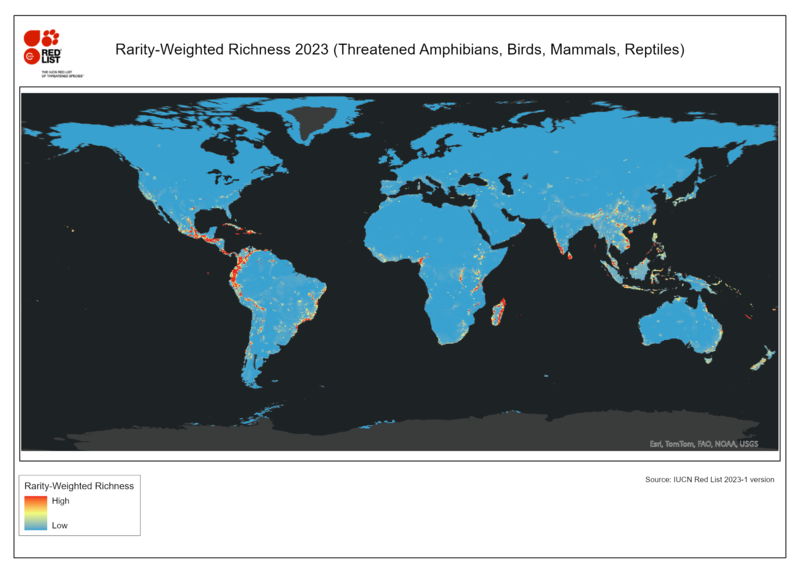
- All Red List Categories
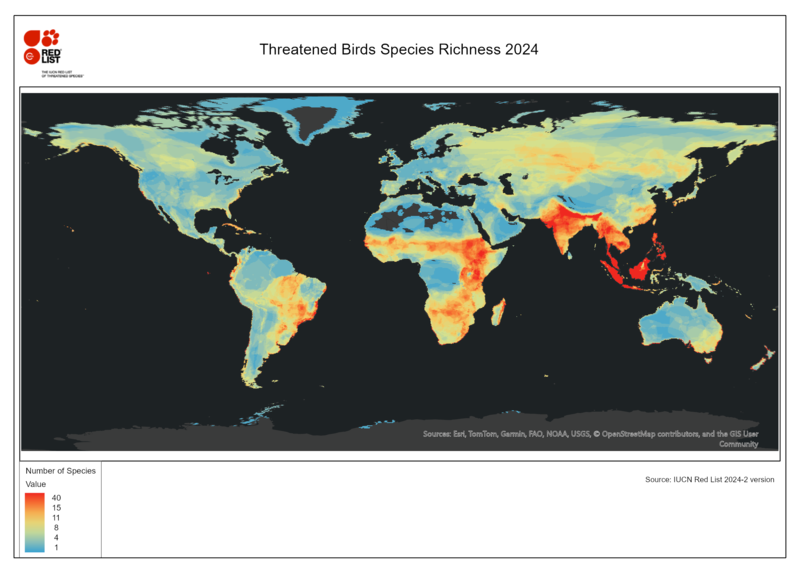
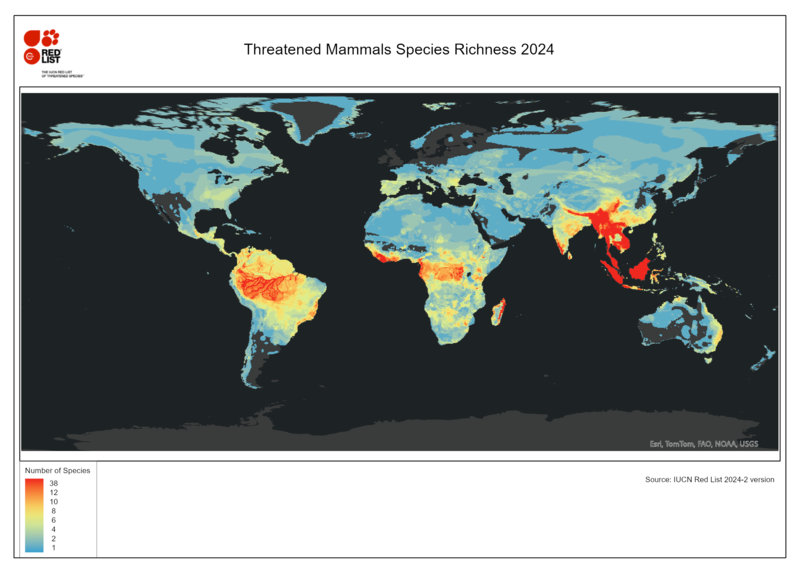
- Threatened species - species assessed as:
- CR (Critically Endangered),
- EN (Endangered) and
- VU (Vulnerable).
Each analysis was exported to a raster in the Mollweide projection, a projection that preserves equal areas across the globe. The raster cell size is 900 km2 (30 km square). For the png images, the raster was reprojected to WGS84 and symbolised (in ArcMap) using the Standard Deviations (2.5) stretch.
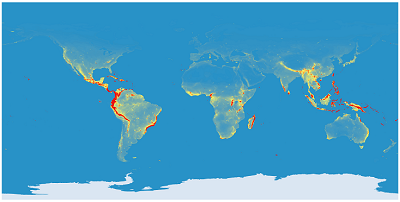
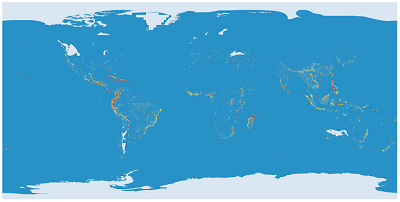
Area of Habitat refines the raw polygon species ranges using habitat and elevation data. The process of creating AoH rasters from IUCN species polygon ranges is still under development and currently has only been applied to the 2021-3 Red List data for birds and mammals.
Downloads
Each analysis is available as:
- raster geotiff (.tif)
- Species Richness from range polygons (file size less than 0.5 MB)
- Rarity-Weighted Richness from range polygons (file size less than 2 MB)
- Species Richness from AoH rasters (file size 3 MB - 6 MB)
- Rarity-Weighted Richness from AoH rasters (file size 30MB - 45 MB)
- high resolution (2,000 dpi) image (.png)
- png from range polygons 2021 (file size 3 MB - 11MB)
- zipped png from range polygons 2022 (file size 2 MB - 6 MB)
- zipped png from AoH rasters (file size 3 MB - 6 MB)
- lower resolution image (.pdf) - latest version only
- clicking on the thumbnail image will download a lower resolution pdf image (file size less than 1.5 MB)
Red List version 2024-2 Species Richness
| Group(s) | All Red List Categories | Threatened Species |
|---|---|---|
| Amphibians, Birds, Mammals and Reptiles |
Species Richness raster
high resolution image
|
Species Richness raster
high resolution image
|
|
Amphibians |
Species Richness raster
high resolution image
|
Species Richness raster
high resolution image
|
|
Birds |
Species Richness raster
high resolution image
|
Species Richness raster
high resolution image
|
|
Mammals |
Species Richness raster
high resolution image
|
Species Richness raster
high resolution image
|
|
Reptiles |
Species Richness raster
high resolution image
|
Species Richness raster
high resolution image
|

Red List version 2024-2 Rarity-Weighted Richness


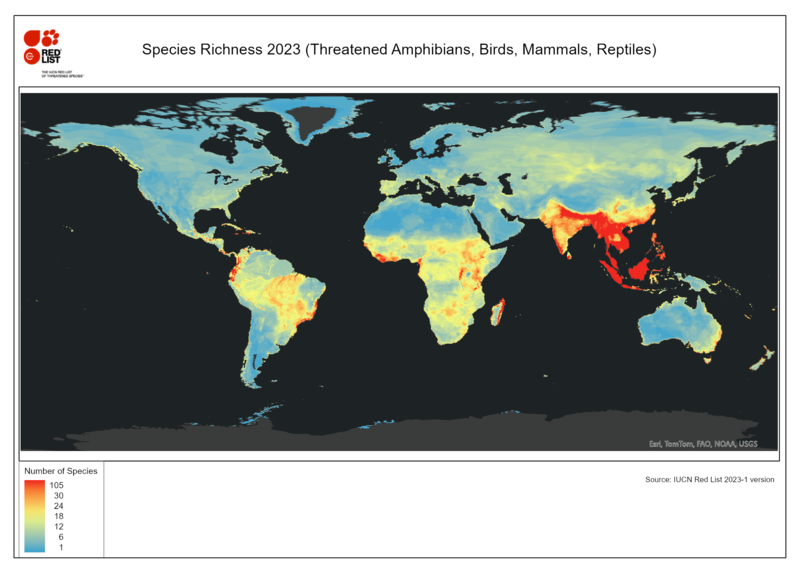
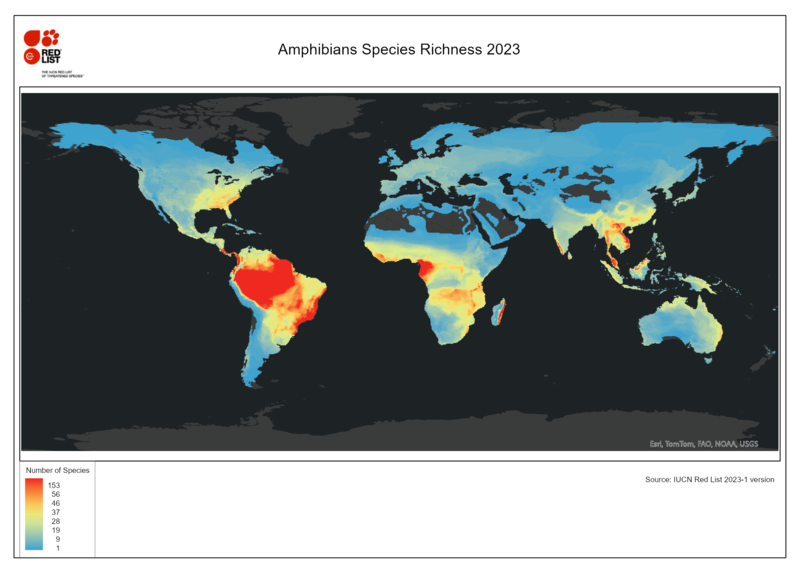
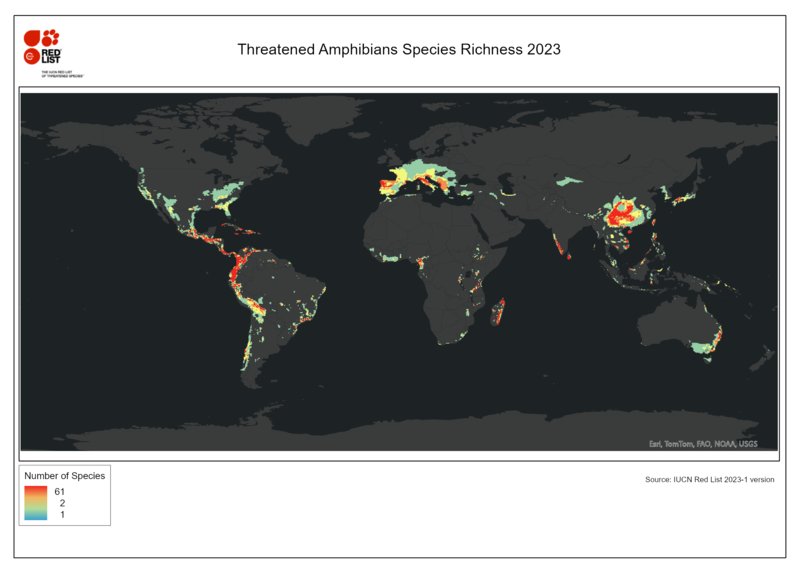
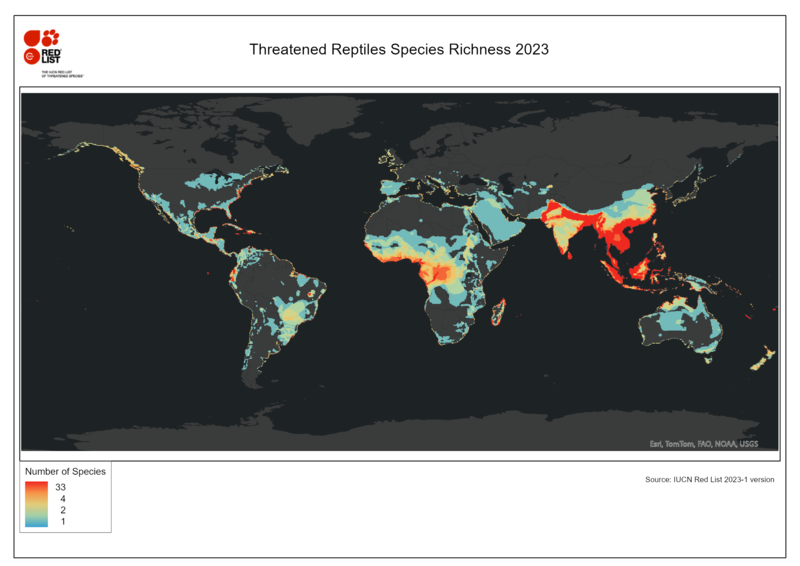
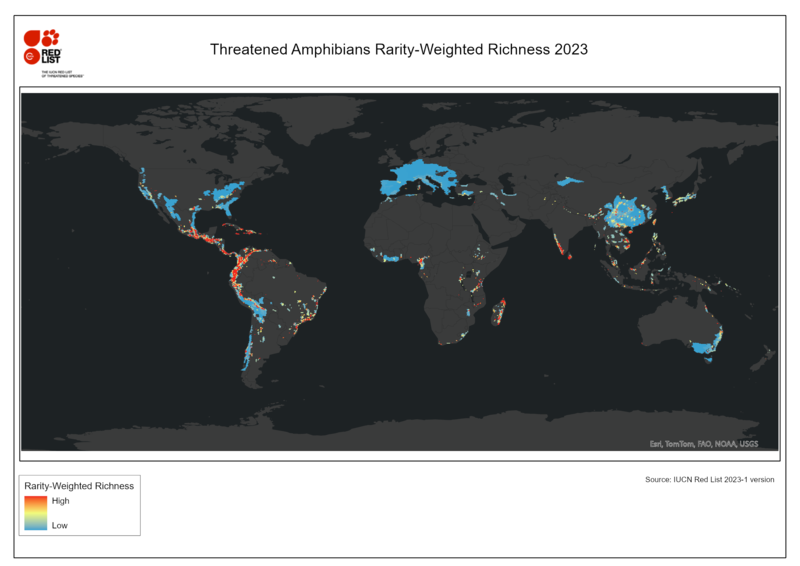
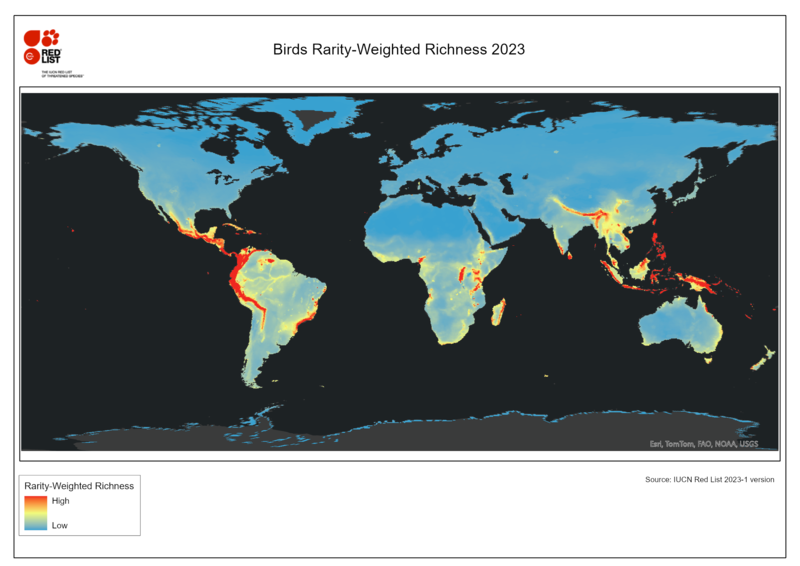
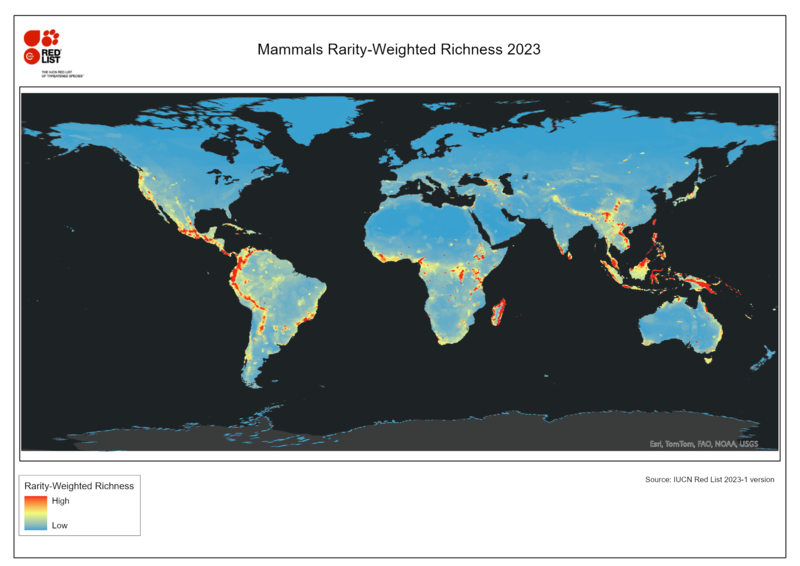
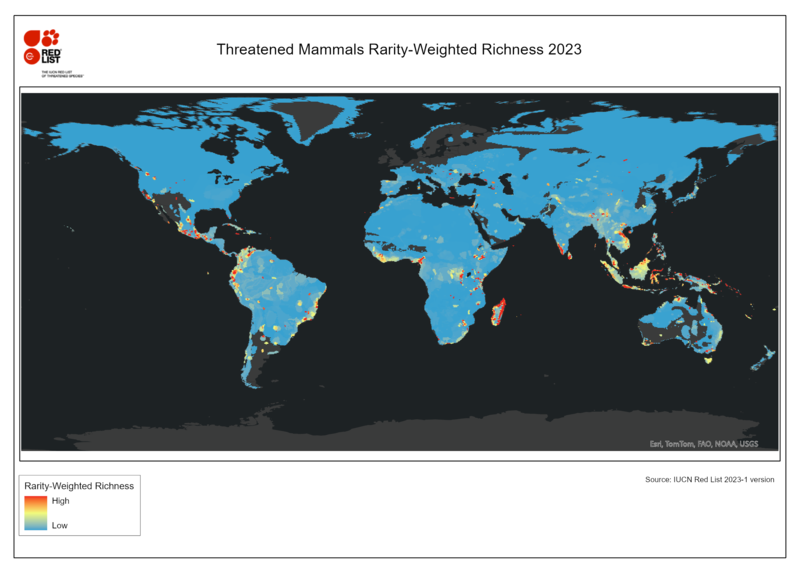
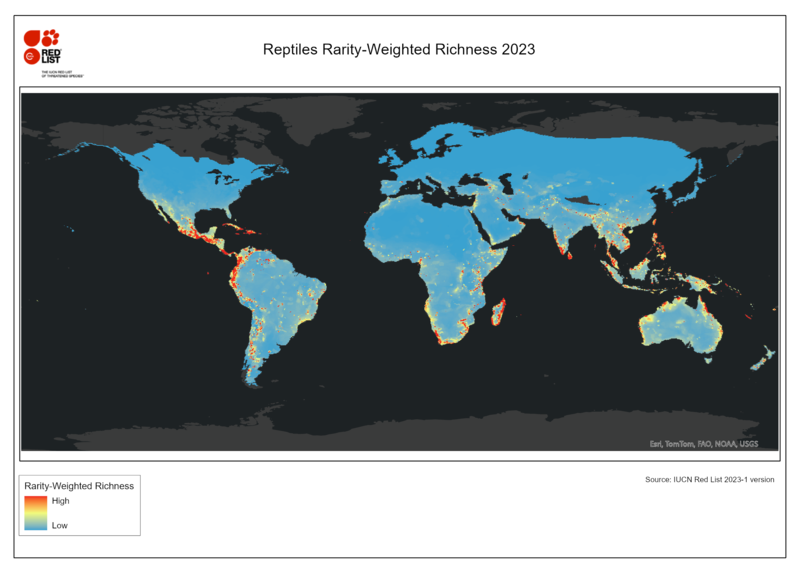
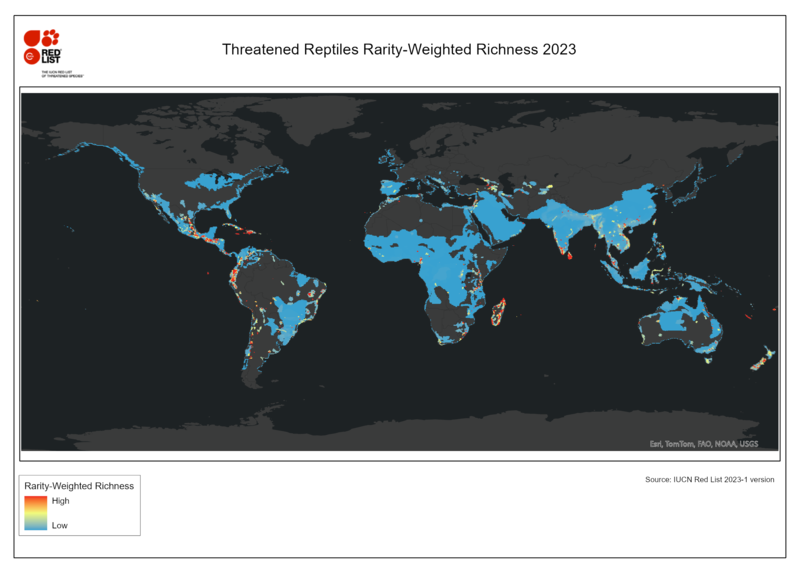
Red List version 2023-1 Species Richness
| Group(s) | All Red List Categories | Threatened Species |
|---|---|---|
| Amphibians, Birds, Mammals and Reptiles |
Species Richness raster
high resolution image
|
Species Richness raster
high resolution image
|
|
Amphibians |
Species Richness raster
high resolution image
|
Species Richness raster
high resolution image
|
|
Birds |
Species Richness raster
high resolution image
|
Species Richness raster
high resolution image
|
|
Mammals |
Species Richness raster
high resolution image
|
Species Richness raster
high resolution image
|
|
Reptiles |
Species Richness raster
high resolution image
|
Species Richness raster
high resolution image
|


Red List version 2023-1 Rarity-Weighted Richness


Red List version 2022-2 Species Richness
| Group(s) | All Red List Categories | Threatened Species |
|---|---|---|
| Amphibians, Birds, Mammals and Reptiles |
Species Richness raster
high resolution image |
Species Richness raster
high resolution image |
|
Amphibians |
Species Richness raster
high resolution image |
Species Richness raster
high resolution image |
|
Birds |
Species Richness raster
high resolution image |
Species Richness raster
high resolution image |
|
Mammals |
Species Richness raster
high resolution image |
Species Richness raster
high resolution image |
|
Reptiles |
Species Richness raster
high resolution image |
Species Richness raster
high resolution image |
Red List version 2022-2 Rarity-Weighted Richness
Red List version 2021-3 Species Richness
| Group(s) | All Red List Categories | Threatened Species |
|---|---|---|
| Amphibians, Birds and Mammals |
Species Richness raster
high resolution image |
Species Richness raster
high resolution image |
|
Amphibians |
Species Richness raster
high resolution image |
Species Richness raster
high resolution image |
|
Birds |
Species Richness raster
high resolution image |
Species Richness raster
high resolution image |
|
Mammals |
Species Richness raster
high resolution image |
Species Richness raster
high resolution image |
Red List version 2021-3 Species Richness and Rarity-Weighted Richness from AoH maps
The Species Richness raster zip files are between 3MB and 6MB and the Rarity-Weighted Richness zips are between 30 MB and 45 MB. The high resolution image png zips are between 10 MB and 20 MB. Clicking on the thumbnail image will download a lower resolution pdf image.
| Group(s) | Species Richness | Rarity-Weighted Richness |
|---|---|---|
| Birds and Mammals |
Species Richness raster
high resolution image |
Rarity-Weighted Richness raster
high resolution image |
|
Birds |
Species Richness raster
high resolution image |
Rarity-Weighted Richness raster
high resolution image |
|
Mammals |
Species Richness raster
high resolution image |
Rarity-Weighted Richness raster
high resolution image |
Red List version 2017-3 Species Richness
The raw IUCN ranges were rasterised and summed across all amphibian, bird and mammal species to show the number of species potentially occurring in each pixel. Despite there being data values in marine areas, the analyses are only relevant for terrestrial areas, as marine areas are only be represented by birds and mammals.
The raster resolution is about 5 km at the equator.
Amphibians, birds and mammals - All Red List Categories
Download: Species Richness raster (zipped geotiff file, 9.21 MB); image (png, 7.38 MB)
Threatened amphibians, birds and mammals
Download: Species Richness raster (zipped geotiff file, 1.84 MB); image (png, 3.49 MB)
Red List version 2017-3 Rarity-Weighted Richness
The Rarity-Weighted Richness calculations were applied at the species-season level. That is, where a species has more than one seasonality recorded, the range for each seasonality coded is treated as a separate 'range' in the analysis. This is mostly applicable to birds and some migratory mammals, as each seasonal range could house a globally relevant aggregation of a given species.
The raster resolution is about 5 km at the equator.
Amphibians, birds and mammals - All Red List Categories
Download: Rarity-Weighted Richness raster (zipped geotiff file, 35.69 MB); image (png, 5.58 MB)
Amphibians, birds and mammals - Threatened
Download: Rarity-Weighted Richness raster (zipped geotiff file, 37.46 MB); image (png, 2.81 MB)
Acknowledgement
The 2017-3 datasets were put together with the help of UN Environment Programme World Conservation Monitoring Centre.
More details on IUCN Red List species selection and processing
The data was filtered based on the Presence (is/was the species in this area?), Origin (why/ how the species is in this area?) and Seasonality (what is the seasonal presence of the species in the area?) fields.
The selection was limited to species with:
2021 onwards
-
Presence = 1 (extant) or 4 (possibly extinct)
-
Origin = 1 (native), 2 (reintroduced) or 6 (assisted colonisation)
-
Seasonality = 1 (resident) , 2 (breeding season) , 3 (non-breeding season) or 5 (seasonal occurrence uncertain).
2017-3
-
Presence = 1 (extant) or 4 (possibly extinct)
-
Origin = 1 (native) or 2 (reintroduced)
-
Seasonality = 1 (resident) , 2 (breeding season) , 3 (non-breeding season), 4 (passage) or 5 (seasonal occurrence uncertain).
More details on the ISEA10 hexagon grid
The ISEA10 grid is a geodesic discrete global grid system, defined on an icosahedron and projected to the sphere using the inverse Icosahedral Snyder Equal Area (ISEA) Projection. This corresponds to a hexagonal grid composed of individual units (cells) that retain their shape and area (865 km2) throughout the globe. These are more suitable for a range of ecological applications than rectangular grids.