Red List Index (RLI)
The Red List Index (RLI) shows trends in overall extinction risk for species, and is used by governments to track their progress towards targets for reducing biodiversity loss.
Most species that move between categories on The IUCN Red List (see the section Reasons for Changing Category) do so because of improved knowledge or revised taxonomy. It is therefore impossible to determine any meaningful trends in the status of biodiversity simply by looking at overall changes in numbers of threatened species between updates. For this reason, the figures presented in the Summary Statistics for numbers of threatened species in each IUCN Red List since 1996 must be interpreted with extreme care; these figures illustrate increasing assessment efforts by IUCN and its Partners since 1996, helping to refine our current understanding of the status of biodiversity, rather than showing genuine status changes over time.
To address this, the Red List Index (RLI) has been developed, which shows trends in the status of groups of species based only on genuine improvements or deteriorations in status of sufficient magnitude to qualify species for listing in more threatened or less threatened Red List Categories.

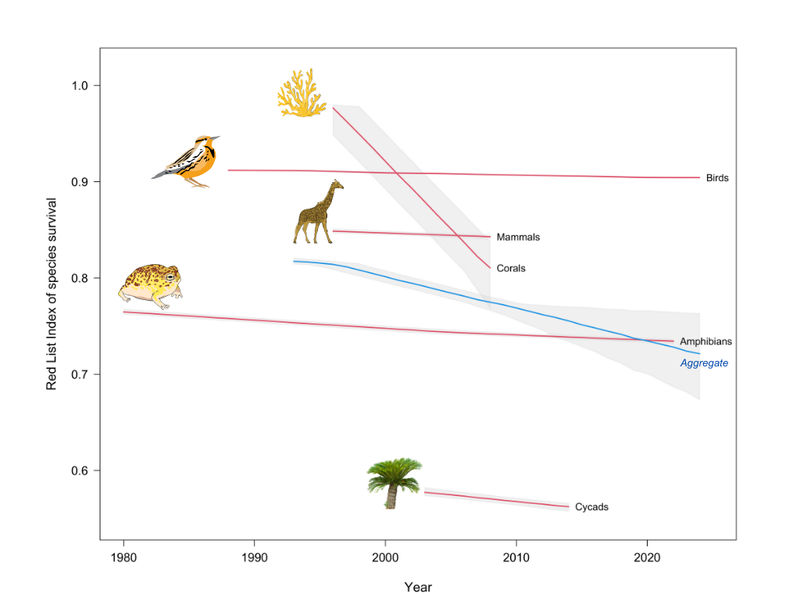
Figure 1: The Red List Index (RLI) of species survival for mammals, birds, amphibians, reef-forming corals and cycads. The blue line indicates the overall RLI for all the taxa combined (Aggregate). Coral species are moving towards increased extinction risk most rapidly, while amphibians are, on average, the most threatened animal group. An RLI value of 1.0 equates to all species qualifying as Least Concern (i.e., not expected to become Extinct in the near future). An RLI value of 0 equates to all species having gone Extinct. A constant RLI value over time indicates that the overall extinction risk for the group is unchanged. If the rate of biodiversity loss were reducing, the RLI would show an upward trend. Confidence intervals (shown in grey) are calculated to take into account the number of Data Deficient species in each group and the uncertainty over exactly when changes in status occurred, given that assessments are repeated only at multi-year intervals, and therefore the precise value for any particular year is uncertain.
Currently, the RLI is available for five taxonomic groups only (those in which all species have been assessed at least twice): birds, mammals, amphibians, cycads and warm-water reef-forming corals (see Figure 1). It has also been aggregated into a single index for those five groups (see Butchart et al. 2010 for methodology). The RLI clearly demonstrates that the status of these major groups is still declining.
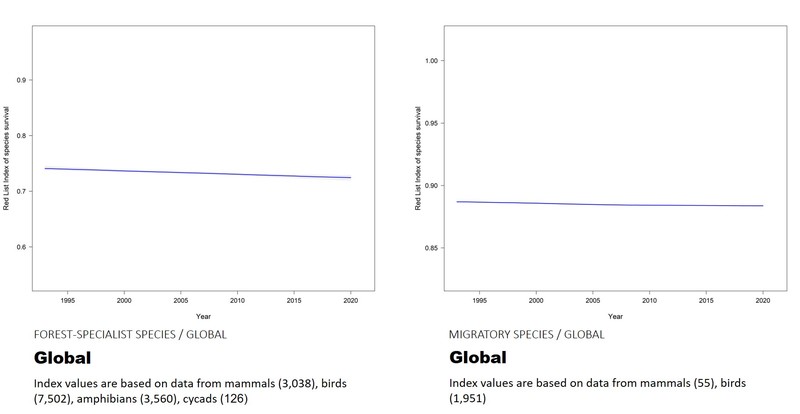
The RLI can be disaggregated in various ways: thematic RLIs show trends for subsets of species of particular policy relevance. For example, the RLI for pollinator species shows trends in the status of species that are particularly important for the role they play in plant pollination, while the RLI for forest-specialist species (Figure 2) is an indicator of the balance between loss and degradation of the world's forests and efforts to conserve and restore them. Other thematic RLIs show trends for all species (in the groups for which repeated Red List assessments have been carried out) driven by particular factors, such as invasive alien species, to illustrate the balance between the negative impacts and spread of such species, and the efforts to control or eradicate them.

Figure 2: Disaggregated Red List Indices for forest-specialist species (left) and migratory species (right). The forest-specialist species are on average more threatened than the migratory species and show a steeper decline towards extinction.
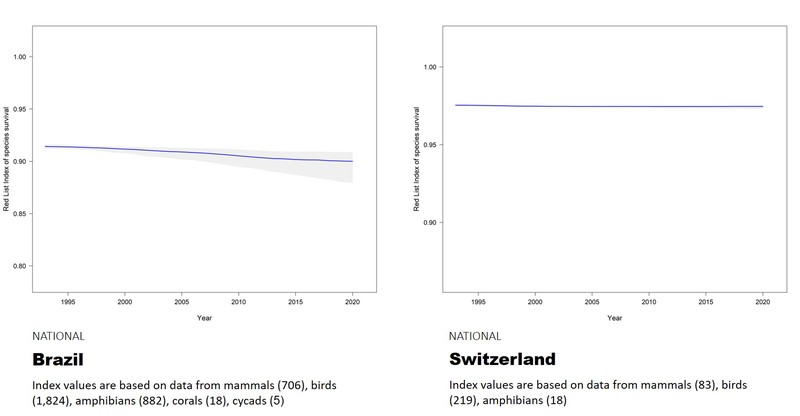
To calculate the RLI for individual countries or regions, each species contributing to the index is weighted by the proportion of its global range within the particular country or region building on the methodology published by Rodrigues et al. (2014). The resulting index therefore shows the aggregate extinction risk for species within the country or region relative to its potential contribution to global species extinction risks (within the taxonomic groups included in the RLI). An alternative approach is to produce national RLIs based on repeated assessments of extinction risk at the national scale, following application of the Guidelines for Application of IUCN Red List Criteria at Regional and National Levels (e.g., for Australian birds, species groups in Finland, plants in Spain, etc.).

Figure 3: Disaggregated Red List Indices for the countries of Brazil and Switzerland. Brazil has on average more threatened species than Switzerland and is showing a steeper decline in the RLI towards extinction, but there is more uncertainty in the data. The RLI for Switzerland is more-or-less constant over time, which shows that the extinction risk for these species has not changed.
The Red List Index has been widely adopted in different policy contexts. It was used for assessing progress towards the Convention on Biological Diversity's 2010 target and the 2020 Aichi Biodiversity Targets and in the regional, thematic and global assessments of the Intergovernmental Science-Policy Platform on Biodiversity and Ecosystem Services, the Global Environment Outlook, Global Biodiversity Outlook and other assessment reports and processes. The RLI is currently used as an indicator by the UN Sustainable Development Goals (for which it is an official indicator for Goal 15), the Convention on Migratory Species (and several of its daughter agreements), etc. It has been adopted as a headline indicator for Goal A and Target 4 of the CBD's Kunming-Montreal Global Biodiversity Framework (GBF).
The RLI is one way of representing information on the status of biodiversity from The IUCN Red List. Complementary measures include the proportion of species that are threatened with extinction (as illustrated, for example, in Díaz et al. 2019), and the proportion of species that have declining trends. More broadly, the trends in extinction risk shown by the RLI capture just one aspect of biodiversity loss. Complementary indicators produced from other datasets show trends in population abundance and community intactness.
The methods for calculating the global RLI are described in Butchart et al. 2007 and here, with the methods for calculating confidence intervals to reflect uncertainty (including that introduced by Data Deficient species) and the methods for aggregating the RLI across multiple taxonomic groups described in Butchart et al. 2010. The R code for calculating and plotting thematic, regional and national RLIs is available from a Code Repository.
IUCN and the Red List Partnership are actively working to expand the taxonomic coverage of the RLI (in particular for plants and invertebrates) and its representivity in marine and freshwater ecosystems, and have set out an ambitious strategy to achieve this. As a contribution towards this a sampled approach to Red Listing and the production of RLIs has been developed for taxonomic groups with many species, with baseline RLI values available for reptiles, dragonflies, fishes, monocot plants, dicot plants, ferns and their relatives, and mosses.
The graphs and datasets for the latest global, regional, national and thematic RLIs are available via the Advanced Search filters (select Red List Indices).
More publications about the Red List Index (in addition to the ones cited above) are available in the Resources and Publications section (search for "Red List Index").

