The IUCN Green Status of Species
Teaming up with the Red List to tell a species’ full conservation story
The IUCN Red List of Threatened Species™ is the global standard for assessing the risk of extinction that individual species of animal, fungus, and plant face. But we also need an optimistic vision of species conservation that presents a road map for recovery. To achieve this, the Red List assessment process has been expanded to include new classifiers of species recovery and conservation impact, known as the Green Status of Species.
The IUCN Green Status of Species complements the Red List by providing a tool for assessing the recovery of species’ populations and measuring their conservation success. In 2020, Green Status of Species assessments became an optional part of Red List assessments.
Background
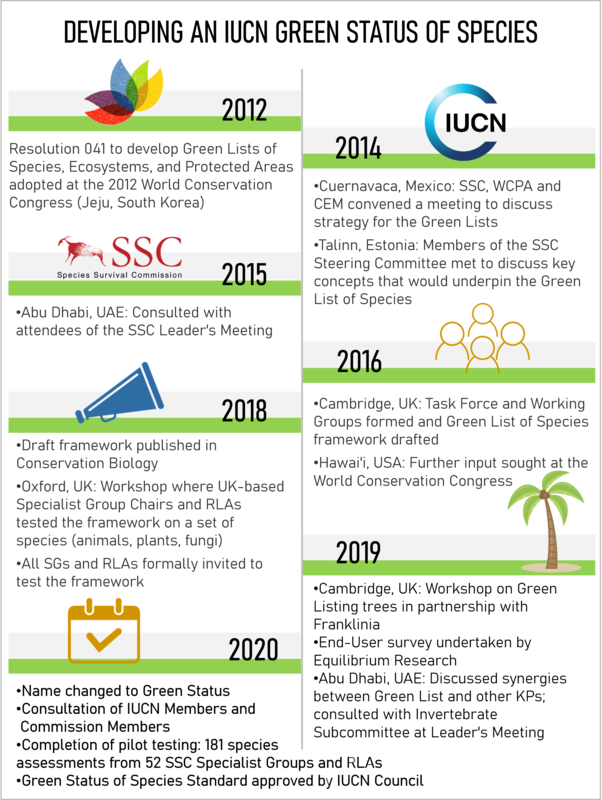
The Green Status of Species was developed in response to Resolution WCC-2012-RES-41 (the timeline for the development is shown in Figure 1). In this Resolution, IUCN called for the development of ‘Green Lists’ of Species, Ecosystems and Protected Areas, in order to measure conservation success in these three areas. Since 2012, a Green List of Protected and Conserved Areas has been launched, and the development of the Green Status of Species began under the name ‘Green List of Species’. However, consultations conducted to date have indicated that the aims of the Resolution would best be served by changing the name. Reasons for this include:
- The misconception, frequently encountered in consultation, that a species assessed on a Green “List” is no longer in need of conservation; and
- Potential brand confusion between this Knowledge Product and the Green List of Protected and Conserved Areas, which follows a very distinct and different method.

Figure 1. Timeline for the development of the methodology for assessing the Green Status of Species.
How Does the Green Status of Species Define Recovery?
The Green Status assesses species against three essential facets of recovery (Akçakaya et al. 2018):
- A species is fully recovered if it is present in all parts of its range, even those that are no longer occupied but were occupied prior to major human impacts/disruption; AND
- It is viable (i.e., not threatened with extinction) in all parts of the range; AND
- It is performing its ecological functions in all parts of the range.
These factors contribute towards a “Green Score” ranging from 0–100%, which shows how far a species is from its "fully recovered" state.
This definition of recovery is ambitious by design. It is not expected, nor is it a goal that all species will eventually fulfil this definition of full recovery; for many species, large areas of range have been irreversibly converted for human uses. Instead, this definition serves as a way to standardize the assessment approach between species, and to identify areas of opportunity in the context of what has been lost. It is important to note that any species can be assessed using the Green Status method, including species that have been very negatively impacted by humans and species that are not considered to have been impacted much at all.
For more information on how the Green Score is calculated, see the Measuring Recovery page.
Measuring Conservation’s Impact
A major strength of the Green Status is its potential to tell the story of a species: How has its status changed over time, and how might it change with conservation action in the future?
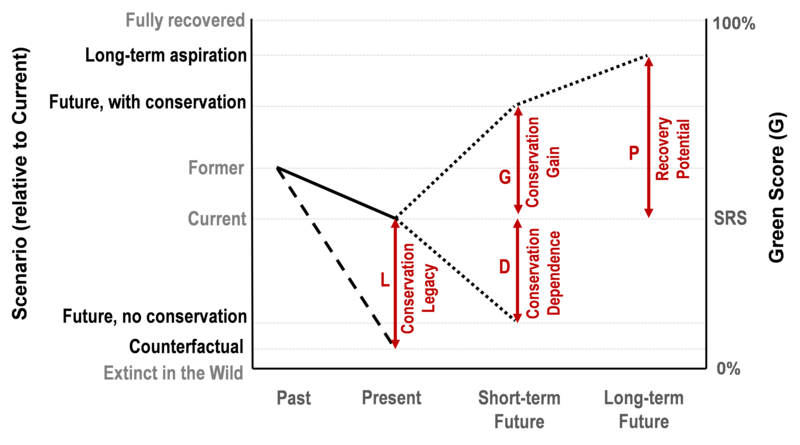
Green Scores can be calculated at different points in time (scenarios) to show the current status, how conservation actions have affected that current status, what we might expect if conservation actions were halted, and how a species’ status might be improved in the future with conservation action. This is reflected in a set of metrics which are based on differences in Green Scores calculated for different times and scenarios (Figure 2).

Figure 2. The four conservation metrics assessed for the Green Status of Species. The Green Score (G) (right y-axis) is estimated at each of the bolded scenarios on the left y-axis. Contextual reference points are also provided on the left y-axis. The differences between the Green Score generated under a scenario and the current Green Score (i.e., the Species Recovery Score, labelled SRS) produce the four Conservation Metrics (red arrows and text). Figure adapted from Akçakaya et al. (2018).
Conservation Legacy captures the impact that past conservation interventions have had on maintaining or achieving current species status, ranging from high legacy (conservation actions have greatly improved species status) to low legacy (actions have been ineffective or have not been attempted).
Conservation Dependence captures what is expected to happen over the next ten years if current conservation actions were to cease, ranging from high dependence (species status would quickly deteriorate in the absence of continued action) to low dependence (species status would not change if conservation action was halted).
Recovery is measured in the short- and long-term. Conservation Gain captures the change in status expected to occur within the next ten years resulting from planned conservation actions. Recovery Potential represents the ‘reach goal’: given the state of the world today, across what proportion of historical range could we expect to be able to restore functional populations? For example, the Tiger’s (Panthera tigris) historic range overlaps with present-day Jakarta; it would be impossible to restore tigers to this part of their historic range.
Why Go Green?
The Green Status will complement the Red List to provide a more comprehensive look at species conservation status. For example, some species, such as the Saltwater Crocodile (Crocodylus porosus) are considered Least Concern on the Red List but have been extirpated or are most likely ecologically extinct across much of their historical range. Despite being at a low risk of extinction, are we willing to call this species “fully recovered”?
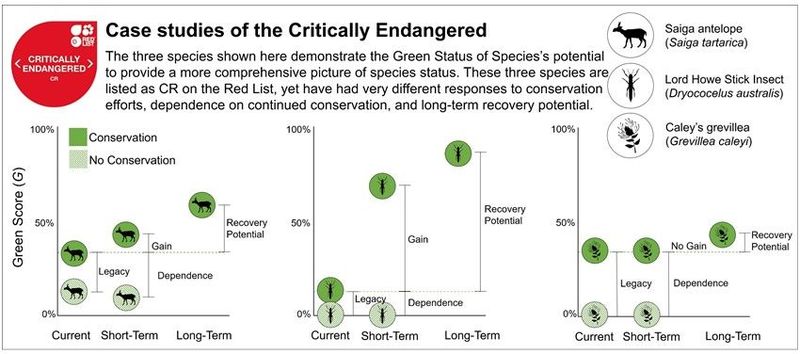
The Green Status of Species also highlights the impact of past conservation and the dependence of many species on continued conservation efforts. For example, past conservation has had a major role to play in keeping these three species (Figure 3) from extinction, even though they are still considered Critically Endangered. With continued conservation efforts, some have the potential to recover substantially in the future.
 Figure 3. Case studies of three Critically Endangered species.

